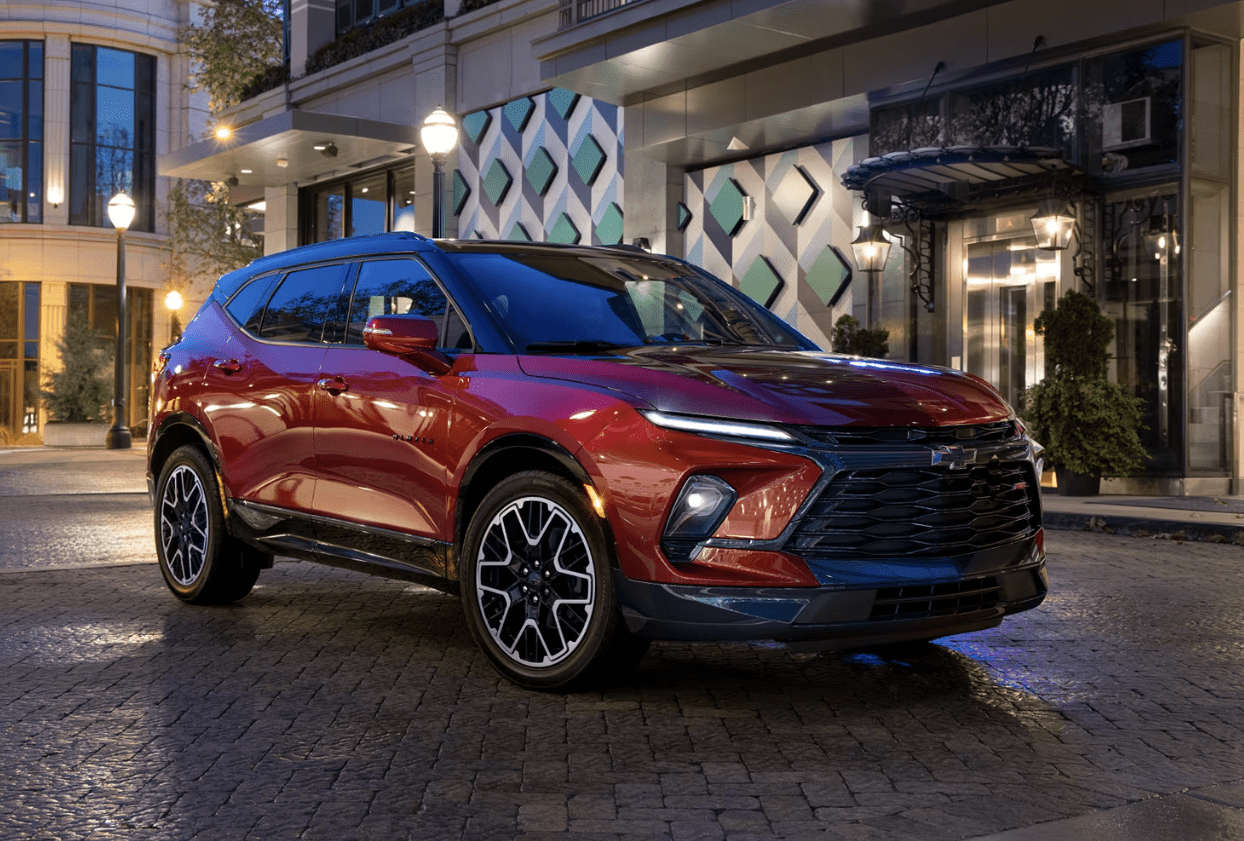
Chevrolet Blazer
Here you will find monthly and yearly United States and Canadian sales figures for the Chevrolet Blazer. The Blazer nameplate has covered two very different vehicles: the original truck-based and mid-size Blazers sold from the 1980s into the 2000s, and the mid-size crossover revived for the 2019 model year. These figures cover the gasoline Blazer; the electric Blazer EV is tracked separately. The modern Blazer competes with the Nissan Murano, Honda Passport, Jeep Grand Cherokee, and Hyundai Santa Fe.
- Class: Mid-size crossover SUV
- Engines: 2.0L turbocharged four-cylinder, 228 horsepower and 258 lb-ft; available 3.6L V6, 308 horsepower and 270 lb-ft (RS)
- Transmission: Nine-speed automatic
- Drivetrain: Front-wheel drive or all-wheel drive
- Seating: Five passengers
- Chief rivals: Nissan Murano, Honda Passport, Jeep Grand Cherokee, Hyundai Santa Fe
Chevrolet Blazer Sales in the United States
Chevrolet Blazer sales in the United States span two distinct vehicles. The original Blazer sold in six-figure volumes through the 1990s, peaking above 250,000 in 1994 before winding down by the mid-2000s. Chevrolet revived the Blazer as a mid-size crossover for 2019, and these modern figures exclude the separately tracked Blazer EV. The revived Blazer opened at 58,116 in 2019, peaked at 94,598 in 2020, and has since held in the 51,000 to 67,000 range, reaching 55,815 in 2025, up about 9 percent from 2024. Through June 2026 Chevrolet had delivered 22,710.
Chevrolet Blazer, United States calendar-year unit sales, 1986–2026. 2026 is January–Sep (partial).
Annual sales
| Year | Units | YoY |
|---|---|---|
| 1986 | 159,820 | — |
| 1987 | 153,064 | ▼ 4.2% |
| 1988 | 184,500 | ▲ 20.5% |
| 1989 | 178,691 | ▼ 3.1% |
| 1990 | 146,989 | ▼ 17.7% |
| 1991 | 123,346 | ▼ 16.1% |
| 1992 | 147,742 | ▲ 19.8% |
| 1993 | 167,201 | ▲ 13.2% |
| 1994 | 250,991 | ▲ 50.1% |
| 1995 | 247,661 | ▼ 1.3% |
| 1996 | 246,307 | ▼ 0.5% |
| 1997 | 221,400 | ▼ 10.1% |
| 1998 | 219,710 | ▼ 0.8% |
| 1999 | 232,140 | ▲ 5.7% |
| 2000 | 225,948 | ▼ 2.7% |
| 2001 | 149,195 | ▼ 34.0% |
| 2002 | 95,937 | ▼ 35.7% |
| 2003 | 53,426 | ▼ 44.3% |
| 2004 | 32,950 | ▼ 38.3% |
| 2005 | 4,936 | ▼ 85.0% |
| 2006 | 114 | ▼ 97.7% |
| 2007 | 7 | ▼ 93.9% |
| 2018 | 27 | ▲ 285.7% |
| 2019 | 58,116 | ▲ 215,144.4% |
| 2020 | 94,598 | ▲ 62.8% |
| 2021 | 70,323 | ▼ 25.7% |
| 2022 | 67,247 | ▼ 4.4% |
| 2023 | 65,512 | ▼ 2.6% |
| 2024 | 51,144 | ▼ 21.9% |
| 2025 | 55,815 | ▲ 9.1% |
| 2026 (Jan–Sep) | 27,909 | ▼ 39.5% YTD |
Monthly sales
| Year | Jan | Feb | Mar | Apr | May | Jun | Jul | Aug | Sep | Oct | Nov | Dec | Total |
|---|---|---|---|---|---|---|---|---|---|---|---|---|---|
| 1986 | — | — | — | — | — | — | — | — | — | — | — | 159,820 | 159,820 |
| 1987 | — | — | — | — | — | — | — | — | — | — | — | 153,064 | 153,064 |
| 1988 | — | — | — | — | — | — | — | — | — | — | — | 184,500 | 184,500 |
| 1989 | — | — | — | — | — | — | — | — | — | — | — | 178,691 | 178,691 |
| 1990 | — | — | — | — | — | — | — | — | — | — | — | 146,989 | 146,989 |
| 1991 | — | — | — | — | — | — | — | — | — | — | — | 123,346 | 123,346 |
| 1992 | — | — | — | — | — | — | — | — | — | — | — | 147,742 | 147,742 |
| 1993 | — | — | — | — | — | — | — | — | — | — | — | 167,201 | 167,201 |
| 1994 | — | — | — | — | — | — | — | — | — | — | — | 250,991 | 250,991 |
| 1995 | — | — | — | — | — | — | — | — | — | — | — | 247,661 | 247,661 |
| 1996 | — | — | — | — | — | — | — | — | — | — | — | 246,307 | 246,307 |
| 1997 | — | — | — | — | — | — | — | — | — | — | — | 221,400 | 221,400 |
| 1998 | — | — | — | — | — | — | — | — | — | — | — | 219,710 | 219,710 |
| 1999 | — | — | — | — | — | — | — | — | — | — | — | 232,140 | 232,140 |
| 2000 | — | — | — | — | — | — | — | — | — | — | — | 225,948 | 225,948 |
| 2001 | — | — | — | — | — | — | — | — | — | — | — | 149,195 | 149,195 |
| 2002 | — | — | — | — | — | — | — | — | — | — | — | 95,937 | 95,937 |
| 2003 | — | — | — | — | — | — | — | — | — | — | — | 53,426 | 53,426 |
| 2004 | — | — | — | — | — | — | — | — | — | — | — | 32,950 | 32,950 |
| 2005 | 865 | 691 | 803 | 600 | 539 | 534 | 366 | 155 | 158 | 82 | 83 | 60 | 4,936 |
| 2006 | 21 | 44 | 13 | 6 | 2 | 7 | 5 | 10 | 1 | 2 | 2 | 1 | 114 |
| 2007 | 0 | 2 | — | 5 | — | — | — | — | — | — | — | — | 7 |
| 2018 | — | — | — | — | — | — | — | — | — | — | — | 27 | 27 |
| 2019 | 994 | 955 | 1,074 | 3,826 | 4,415 | 3,532 | 6,682 | 7,483 | 6,147 | 7,576 | 7,856 | 7,576 | 58,116 |
| 2020 | 7,192 | 9,312 | 5,640 | 3,551 | 7,890 | 8,285 | 10,339 | 9,190 | 9,956 | 7,841 | 6,441 | 8,961 | 94,598 |
| 2021 | 6,165 | 6,165 | 6,935 | 6,952 | 6,685 | 6,952 | 3,538 | 3,407 | 3,538 | 6,662 | 6,662 | 6,662 | 70,323 |
| 2022 | 6,019 | 6,019 | 6,771 | 4,886 | 4,705 | 4,705 | 5,763 | 5,985 | 5,763 | 5,544 | 5,322 | 5,765 | 67,247 |
| 2023 | 5,021 | 4,820 | 5,422 | 6,105 | 5,870 | 6,105 | 4,973 | 5,371 | 5,172 | 5,478 | 5,478 | 5,697 | 65,512 |
| 2024 | 5,656 | 5,656 | 5,883 | 2,154 | 4,353 | 4,353 | 3,637 | 4,074 | 3,346 | 3,548 | 4,165 | 4,319 | 51,144 |
| 2025 | 4,837 | 4,643 | 5,030 | 4,429 | 4,600 | 4,089 | 6,564 | 5,741 | 6,214 | 3,022 | 3,067 | 3,579 | 55,815 |
| 2026 | 3,661 | 3,379 | 3,660 | 4,055 | 3,899 | 4,056 | 1,753 | 1,784 | 1,662 | — | — | — | 27,909 |
Chevrolet Blazer Sales in Canada
In Canada the revived Blazer has generally sold between 2,700 and 4,100 units a year since 2019. Canadian volume spiked to 9,793 in 2024 before returning to 4,749 in 2025; the 2024 figure stands out sharply against the surrounding years and is best treated with some caution.
Chevrolet Blazer, Canada calendar-year unit sales, 2004–2026. 2026 is January–Jun (partial).
Annual sales
| Year | Units | YoY |
|---|---|---|
| 2004 | 3,004 | — |
| 2005 | 7,579 | ▲ 152.3% |
| 2006 | 3 | ▼ 100.0% |
| 2019 | 2,738 | ▲ 91,166.7% |
| 2020 | 3,861 | ▲ 41.0% |
| 2021 | 3,419 | ▼ 11.4% |
| 2022 | 3,503 | ▲ 2.5% |
| 2023 | 4,081 | ▲ 16.5% |
| 2024 | 9,793 | ▲ 140.0% |
| 2025 | 4,749 | ▼ 51.5% |
| 2026 (Jan–Jun) | 1,564 | ▼ 41.6% YTD |
Monthly sales
| Year | Jan | Feb | Mar | Apr | May | Jun | Jul | Aug | Sep | Oct | Nov | Dec | Total |
|---|---|---|---|---|---|---|---|---|---|---|---|---|---|
| 2004 | 125 | 127 | 192 | 185 | 126 | 90 | 119 | 177 | 311 | 135 | 691 | 726 | 3,004 |
| 2005 | 557 | 1,285 | 1,608 | 1,237 | 908 | 742 | 569 | 357 | 159 | 53 | 48 | 56 | 7,579 |
| 2006 | 3 | 0 | 0 | 0 | 0 | 0 | 0 | 0 | 0 | 0 | 0 | 0 | 3 |
| 2019 | 32 | 29 | 31 | 214 | 214 | 195 | 395 | 395 | 360 | 313 | 272 | 288 | 2,738 |
| 2020 | 221 | 200 | 222 | 327 | 298 | 329 | 461 | 440 | 441 | 316 | 288 | 318 | 3,861 |
| 2021 | 317 | 317 | 366 | 339 | 309 | 341 | 210 | 220 | 212 | 258 | 258 | 272 | 3,419 |
| 2022 | 242 | 230 | 267 | 316 | 316 | 334 | 258 | 297 | 273 | 323 | 323 | 324 | 3,503 |
| 2023 | 216 | 197 | 228 | 409 | 450 | 452 | 377 | 434 | 378 | 328 | 313 | 299 | 4,081 |
| 2024 | 526 | 503 | 504 | 1,152 | 1,152 | 1,048 | 849 | 849 | 773 | 875 | 761 | 801 | 9,793 |
| 2025 | 469 | 426 | 450 | 458 | 438 | 439 | 325 | 310 | 312 | 403 | 333 | 386 | 4,749 |
| 2026 | 232 | 208 | 229 | 295 | 310 | 290 | — | — | — | — | — | — | 1,564 |