Activate Your Premium Data Experience >

2016 Year End Canada Vehicle Sales Rankings – Top 283 Best-Selling Vehicles In Canada – Every Vehicle Ranked

2017 Bentley Bentayga blue
After record Canadian auto sales were achieved in 2013, and 2014, and 2015, new vehicle sales volume jumped 3% to a new, all-time annual record in calendar year 2016.

Canadian consumers, businesses, and governments purchased and leased 1.95 million new vehicles in 2016, a gain of roughly 50,000 sales for an industry that lost nearly 53,000 passenger car sales.

Canada Auto Sales Brand Rankings – 2016 Year End
Canada Car Sales By Model – 2016 Year End
Canada SUV/Crossover Sales By Model – 2016 Year End

Led by the Ford F-Series pickup truck, Canada’s best-selling line of new vehicles for a eighth consecutive year, pickup truck sales jumped 8%, a gain of 27,000 units. 
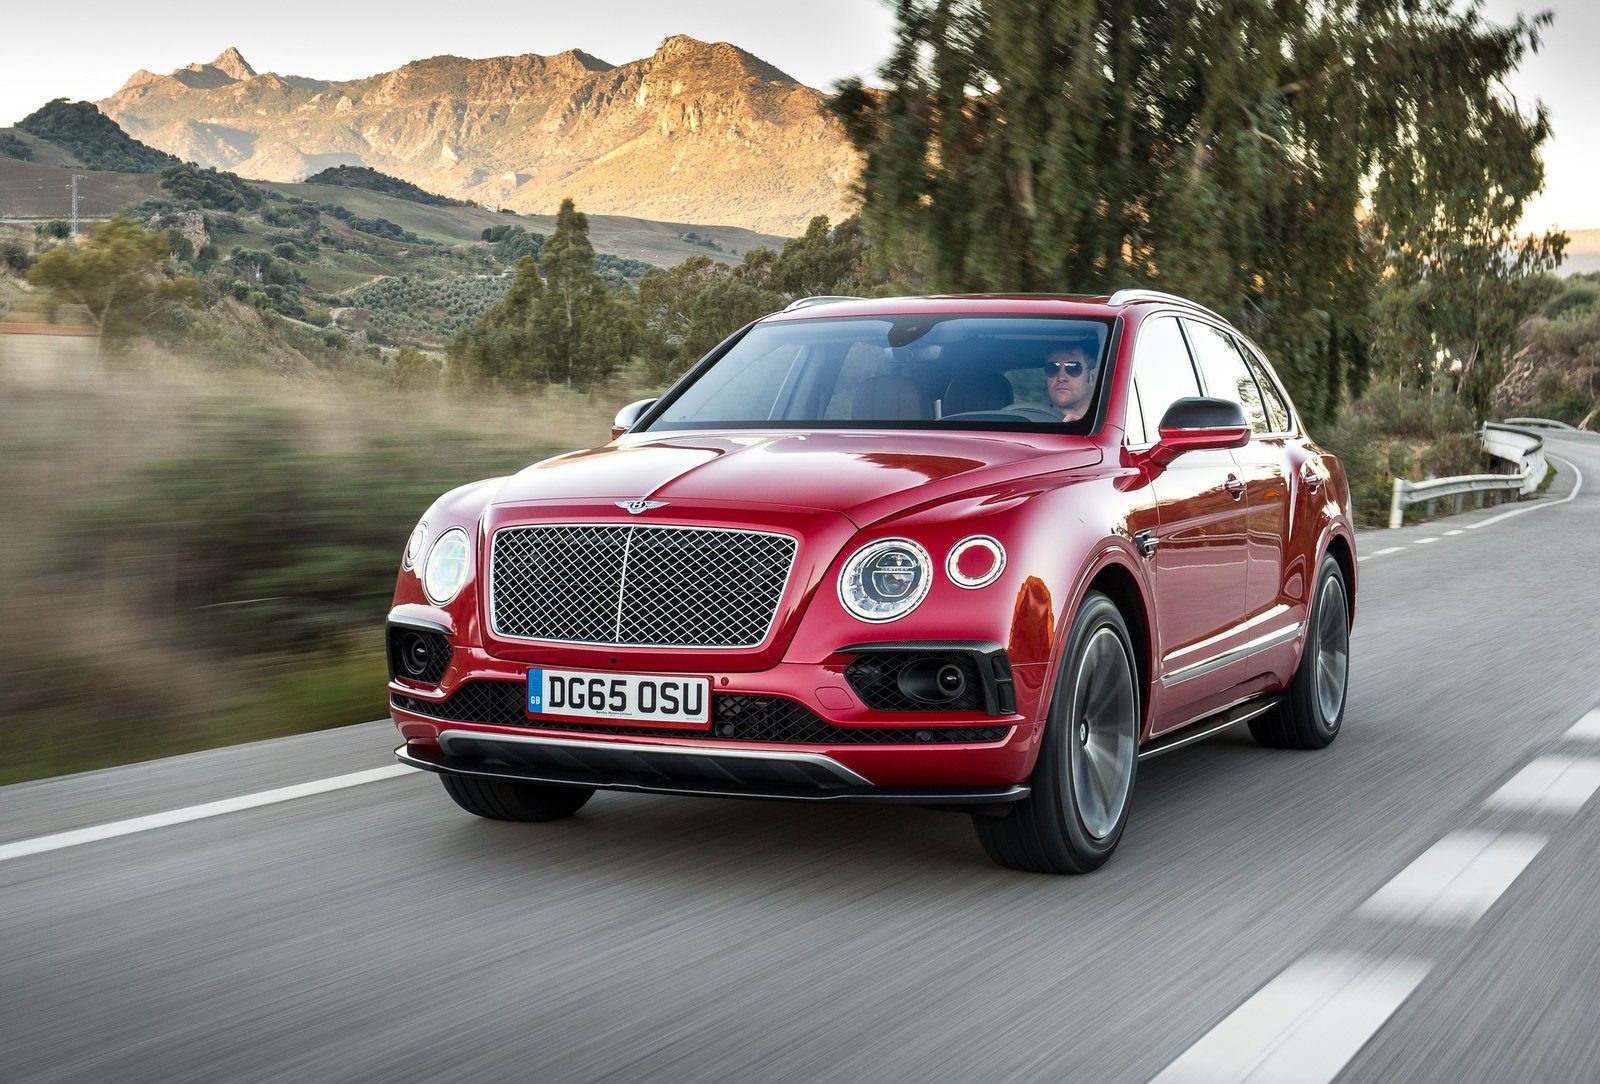
SUV/crossover volume jumped 10% to form 40% of the Canadian auto industry’s volume. Sales across the sector jumped by more than 71,000 units compared with 2015, as the Toyota RAV4 led all SUVs/crossovers in total sales for the first time ever.

New vehicles were common in 2016. We saw the introduction of a new brand: Genesis. Cadillac, Volvo, Jaguar, and Lincoln launched new sedans: CT6, S90, XE Continental, respectively. 

Fiat introduced the new 124 Spider, a Mazda MX-5 Miata twin. New luxury SUVs were launched by Bentley, Infiniti, Jaguar, and Maserati.

But the overwhelming bulk of new vehicle sales volume – more than half – is generated by the 30 top nameplates. The Ford F-Series, Ram P/U, and Honda Civic alone create 15 out of every 100 new vehicle sales. 

Canada Vehicle Sales Rankings By Model – January 2017
Canada Vehicle Sales Rankings By Model – November 2016 YTD
Canada Vehicle Sales Rankings By Model – December 2015/Year End

Reminder: these are 2016 year end rankings, but you can sort vehicles by December 2016 volume by clicking the December 2016 column header, or you can rank vehicles by improvements or declines using the % columns. Or, most importantly, you can list automakers together by selecting the Vehicle column header. 

There are visible brand results, so when you sort the table by vehicle names to showcase, for example, all Fords together, you’ll also see the Ford brand’s total. Auto brands are shown in bold to differentiate makes and models, manufacturers are bolded and italicized. At any time, click the Rank column to return to the original format. If you’re on a mobile device, you may need to choose the full version of the site (at the bottom of the page) in order to use the sortable function.

Canada Pickup Truck Sales By Model – 2016 Year End
Canada Minivan Sales By Model – 2016 Year End

As always, you can find historical monthly and yearly sales figures for any of these vehicles by selecting a make and model at GCBC’s Sales Stats page. Mobile users can now thumb across the table for full-width access.

Click Column Headers To Sort • November 2016December 2015

Rank
Vehicle
2016
2015
%
Change
Dec.
2016
Dec.
2015
% Change
#1 Ford F-Series 145,409 118,837 22.4% 9,987 9,318 7.2%
#2 Ram P/U 89,048 91,195 -2.4% 6,309 6,337 -0.4%
#3 Honda Civic 64,552 64,950 -0.6% 3,164 3,987 -20.6%
#4 Dodge Grand Caravan 51,349 46,927 9.4% 3,480 4,162 -16.4%
#5 GMC Sierra 51,091 53,727 -4.9% 2,735 3,541 -22.8%
#6 Toyota RAV4 49,103 42,246 16.2% 3,000 2,949 1.7%
#7 Hyundai Elantra 48,875 47,722 2.4% 1,852 2,054 -9.8%
#8 Ford Escape 46,661 47,726 -2.2% 2,971 3,159 -6.0%
#9 Toyota Corolla 45,626 47,198 -3.3% 2,215 2,280 -2.9%
#9.1 Toyota Corolla Sedan * 44,785 47,198 -5.1% 2,002 2,280 -12.2%
#9.2 Toyota Corolla iM * 841 213
#10 Chevrolet Silverado 44,932 46,407 -3.2% 2,451 3,252 -24.6%
#11 Honda CR-V 44,789 38,961 15.0% 2,998 2,478 21.0%
#12 Nissan Rogue 40,055 35,841 11.8% 3,171 2,620 21.0%
#13 Jeep Cherokee 32,465 31,833 2.0% 2,115 2,886 -26.7%
#14 Mazda 3 27,689 34,811 -20.5% 1,822 2,078 -12.3%
#15 Chevrolet Cruze 26,824 31,958 -16.1% 2,760 1,706 61.8%
#16 Mazda CX-5 25,123 22,281 12.8% 1,783 1,714 4.0%
#17 Hyundai Santa Fe Sport 24,282 26,685 -9.0% 1,315 1,864 -29.5%
#18 Hyundai Tucson 23,789 16,362 45.4% 1,006 813 23.7%
#19 Volkswagen Jetta 20,954 27,719 -24.4% 636 1,411 -54.9%
#20 Ford Edge 20,517 16,580 23.7% 1,082 519 109%
#21 Volkswagen Golf 19,966 20,515 -2.7% 1,041 1,615 -35.5%
#21.1 Volkswagen Golf * 17,513 17,890 -2.1% 933 1,477 -36.8%
#21.2 Volkswagen Golf GTI * 2,453 2,625 -6.6% 108 138 -21.7%
#22 Hyundai Accent 19,198 19,371 -0.9% 624 706 -11.6%
#23 Chevrolet Equinox 19,197 19,766 -2.9% 1,659 1,558 6.5%
#24 Jeep Wrangler 18,277 20,880 -12.5% 770 1,215 -36.6%
#25 Dodge Journey 16,741 25,646 -34.7% 1,303 2,257 -42.3%
#26 Ford Focus 16,627 21,101 -21.2% 1,062 1,033 2.8%
#27 Toyota Camry 15,683 16,805 -6.7% 835 672 24.3%
#28 Kia Sorento 15,466 14,372 7.6% 824 876 -5.9%
#29 Ford Explorer 15,275 15,615 -2.2% 1,013 1,253 -19.2%
#30 Jeep Grand Cherokee 14,912 11,605 28.5% 860 953 -9.8%
#31 Ford Fusion 14,424 15,781 -8.6% 911 1,035 -12.0%
#32 Nissan Sentra 14,281 14,940 -4.4% 511 887 -42.4%
#33 Honda Accord 13,857 14,465 -4.2% 905 1,035 -12.6%
#34 Nissan Murano 13,834 10,128 36.6% 822 876 -6.2%
#35 Subaru Forester 13,798 12,706 8.6% 1,202 1,067 12.7%
#36 Toyota Sienna 13,404 13,981 -4.1% 945 889 6.3%
#37 Toyota Highlander 12,964 10,412 24.5% 1,105 769 43.7%
#38 Kia Soul 12,672 13,335 -5.0% 743 812 -8.5%
#38.1 Kia Soul * 11,966 13,062 -8.4% 699 748 -6.6%
#38.2 Kia Soul EV * 706 273 159% 44 64 -31.3%
#39 Toyota Tacoma 12,618 11,772 7.2% 950 959 -0.9%
#40 Honda HR-V 12,371 8,959 38.1% 1,240 779 59.2%
#41 Honda Odyssey 12,311 11,272 9.2% 579 611 -5.2%
#42 Kia Forte 12,296 11,378 8.1% 579 391 48.1%
#43 Subaru Impreza 11,673 11,426 2.2% 758 705 7.5%
#43.1 Subaru Impreza * 7,456 8,319 -10.4% 448 502 -10.8%
#43.2 Subaru Impreza WRX/STI * 4,217 3,107 35.7% 310 203 52.7%
#44 Chevrolet Malibu 11,503 9,203 25.0% 635 391 62.4%
#45 Kia Sportage 11,410 6,509 75.3% 768 414 85.5%
#46 Toyota Tundra 11,364 10,829 4.9% 973 834 16.7%
#47 Subaru Outback 11,255 9,992 12.6% 869 746 16.5%
#48 Volkswagen Tiguan 11,229 11,459 -2.0% 625 965 -35.2%
#49 GMC Terrain 11,095 10,844 2.3% 871 786 10.8%
#50 Ford Transit 10,204 8,767 16.4% 626 619 1.1%
#51 Hyundai Sonata 10,191 13,497 -24.5% 544 507 7.3%
#52 Mercedes-Benz C-Class 9,954 9,992 -0.4% 853 621 37.4%
#53 Nissan Micra 9,896 11,909 -16.9% 453 747 -39.4%
#54 Subaru Crosstrek 9,723 8,422 15.4% 673 599 12.4%
#55 Nissan Pathfinder 9,670 9,898 -2.3% 713 826 -13.7%
#56 Mazda CX-3 9,354 6,861 36.3% 612 687 -10.9%
#57 Chevrolet Trax 9,072 8,156 11.2% 489 590 -17.1%
#58 Jeep Patriot 9,022 9,372 -3.7% 1,042 530 96.6%
#59 Honda Fit 8,622 9,088 -5.1% 1,184 455 160%
#60 Audi Q5 8,313 8,203 1.3% 636 633 0.5%
#61 Lexus RX 8,147 7,063 15.3% 697 711 -2.0%
#62 Acura RDX 8,047 7,380 9.0% 601 467 28.7%
#63 Hyundai Santa Fe XL 7,981 6,561 21.6% 377 457 -17.5%
#64 Toyota Yaris 7,779 8,196 -5.1% 397 428 -7.2%
#64.1 Toyota Yaris Hatchback * 6,342 7,885 -19.6% 359 353 1.7%
#64.2 Toyota Yaris Sedan * 1,437 311 362% 38 75 -49.3%
#65 Nissan Altima 7,753 7,293 6.3% 295 851 -65.3%
#66 Ford Mustang 7,655 6,933 10.4% 292 352 -17.0%
#67 Kia Rio 7,636 9,761 -21.8% 320 408 -21.6%
#68 BMW 3-Series 7,452 9,590 -22.3% 367 459 -20.0%
#69 Nissan Versa 7,417 9,120 -18.7% 436 443 -1.6%
#70 Mercedes-Benz GLE-Class & M-Class ¤ 7,281 6,008 21.2% 434 457 -5.0%
#71 Honda Pilot 7,279 8,230 -11.6% 606 742 -18.3%
#72 Buick Verano 7,244 6,360 13.9% 308 424 -27.4%
#73 GMC Savana 7,012 6,809 3.0% 736 874 -15.8%
#74 Chrysler 200 7,010 10,961 -36.0% 330 623 -47.0%
#75 BMW X5 6,942 5,381 29.0% 636 422 50.7%
#76 Toyota 4Runner 6,677 5,736 16.4% 458 484 -5.4%
#77 Mitsubishi Lancer 6,575 6,008 9.4% 458 444 3.2%
#78 Chevrolet Colorado 6,569 5,095 28.9% 270 403 -33.0%
#79 Mitsubishi Outlander 6,324 6,108 3.5% 563 425 32.5%
#80 Lexus NX 6,295 6,127 2.7% 501 383 30.8%
#81 Mitsubishi RVR 6,196 5,786 7.1% 451 364 23.9%
#82 Dodge Durango 6,175 3,659 68.8% 352 205 71.7%
#83 GMC Canyon 6,083 4,635 31.2% 278 329 -15.5%
#84 Audi A4 º 6,031 5,461 10.4% 376 357 5.3%
#85 Toyota Venza 5,971 6,129 -2.6% 364 358 1.7%
#86 Mini Cooper  5,915 5,638 4.9% 350 441 -20.6%
#87 Buick Encore 5,533 4,915 12.6% 274 285 -3.9%
#88 Acura MDX 5,425 5,814 -6.7% 405 552 -26.6%
#89 BMW X3 5,417 4,527 19.7% 475 320 48.4%
#90 Kia Optima 5,243 6,210 -15.6% 628 455 38.0%
#91 BMW X1 5,205 2,942 76.9% 567 255 122%
#92 Kia Sedona 4,792 2,597 84.5% 274 149 83.9%
#93 Mercedes-Benz GLC-Class & GLK-Class ¤ 4,774 5,304 -10.0% 487 587 -17.0%
#94 BMW 4-Series 4,765 4,942 -3.6% 386 311 24.1%
#95 Mercedes-Benz Sprinter 4,677 4,761 -1.8% 453 364 24.5%
#96 Chevrolet Traverse 4,486 3,998 12.2% 248 225 10.2%
#97 Nissan Juke 4,442 4,473 -0.7% 214 271 -21.0%
#98 Chevrolet Sonic 4,404 5,763 -23.6% 383 301 27.2%
#99 Mercedes-Benz GLA-Class 4,400 3,719 18.3% 281 248 13.3%
#100 Audi Q7 4,335 1,658 162% 216 21 929%
#101 Jeep Compass 4,318 3,729 15.8% 482 339 42.2%
#102 Infiniti QX60 4,238 3,863 9.7% 360 312 15.4%
#103 Chevrolet Express 4,164 3,337 24.8% 462 515 -10.3%
#104 Mercedes-Benz CLA-Class 4,150 3,870 7.2% 213 213 0.0%
#105 Acura TLX 4,137 5,075 -18.5% 307 337 -8.9%
#106 Nissan Frontier 4,127 3,622 13.9% 193 233 -17.2%
#107 Volkswagen Passat ¤ 4,023 5,838 -31.1% 200 366 -45.4%
#107.1 Volkswagen Passat * 3,824 5,432 -29.6% 173 340 -49.1%
#107.2 Volkswagen Passat CC * 199 406 -51.0% 27 26 3.8%
#108 Jeep Renegade 3,964 2,261 75.3% 258 310 -16.8%
#109 GMC Acadia 3,939 6,452 -38.9% 354 566 -37.5%
#110 Audi Q3 3,860 3,596 7.3% 243 331 -26.6%
#111 Audi A3 3,795 3,788 0.2% 262 293 -10.6%
#112 Dodge Charger 3,747 4,518 -17.1% 212 235 -9.8%
#113 Ford Expedition 3,729 2,282 63.4% 453 261 73.6%
#114 Chrysler 300 3,668 4,443 -17.4% 173 444 -61.0%
#115 Chevrolet Spark 3,657 1,561 134% 185 53 249%
#116 Buick Enclave 3,632 3,361 8.1% 126 188 -33.0%
#117 Lincoln MKX 3,551 2,900 22.4% 247 437 -43.5%
#118 Ford E-Series 3,478 2,661 30.7% 190 258 -26.4%
#119 Chevrolet Volt 3,469 1,463 137% 272 220 23.6%
#120 Dodge Challenger 3,160 2,669 18.4% 135 83 62.7%
#121 Land Rover Range Rover Sport 3,151 2,680 17.6% 414 294 40.8%
#122 Toyota Prius C ² 3,135 3,029 3.5% 139 78 78.2%
#123 Mitsubishi Mirage 3,112 3,361 -7.4% 189 159 18.9%
#124 Ford Fiesta 3,093 5,646 -45.2% 132 495 -73.3%
#125 Chevrolet Tahoe 3,062 2,364 29.5% 138 248 -44.4%
#126 Lexus IS 3,033 3,401 -10.8% 147 214 -31.3%
#127 Subaru Legacy 3,001 3,258 -7.9% 181 229 -21.0%
#128 Infiniti Q50 2,969 3,295 -9.9% 264 280 -5.7%
#129 Mercedes-Benz E-Class & CLS-Class ¤ 2,953 3,162 -6.6% 153 256 -40.2%
#130 Volvo XC90 2,951 957 208% 239 94 154%
#131 Toyota Prius ² 2,855 1,624 75.8% 282 98 188%
#132 Chevrolet Impala 2,844 2,938 -3.2% 189 243 -22.2%
#133 GMC Yukon 2,842 1,711 66.1% 114 141 -19.1%
#134 Cadillac Escalade 2,835 2,085 36.0% 505 144 251%
#134.1 Cadillac Escalade * 1,783 1,612 10.6% 315 114 176%
#134.2 Cadillac Escalade ESV * 1,052 473 122% 190 30 533%
#135 Ford Taurus 2,816 3,259 -13.6% 76 89 -14.6%
#136 Chrysler Town & Country 2,815 9,001 -68.7% 10 646 -98.5%
#137 Porsche Macan 2,800 2,121 32.0% 213 146 45.9%
#138 Ford Transit Connect 2,799 2,800 0.0% 181 223 -18.8%
#139 Cadillac XT5 2,789 421
#140 Nissan Titan 2,715 3,226 -15.8% 312 122 156%
#141 Chevrolet Camaro 2,708 2,668 1.5% 131 77 70.1%
#142 Honda Ridgeline 2,622 229 1,045% 369 1 36,800%
#143 Lincoln MKC 2,618 2,970 -11.9% 155 247 -37.2%
#144 GMC Yukon XL 2,604 1,579 64.9% 186 183 1.6%
#145 Ford Flex 2,587 1,789 44.6% 137 88 55.7%
#146 Scion iM 2,569 943 172% 8 179 -95.5%
#147 Chrysler Pacifica 2,557 261
#148 Ram Promaster 2,553 2,640 -3.3% 317 149 113%
#149 Mercedes-Benz B-Class 2,461 2,356 4.5% 162 169 -4.1%
#150 Acura ILX 2,459 2,551 -3.6% 187 267 -30.0%
#151 Mazda CX-9 2,444 1,139 115% 201 71 183%
#152 Volkswagen Beetle 2,402 2,347 2.3% 122 76 60.5%
#153 Mercedes-Benz GLS-Class & GL-Class 2,389 2,473 -3.4% 166 287 -42.2%
#154 Cadillac ATS 2,375 3,493 -32.0% 184 392 -53.1%
#155 Land Rover Discovery Sport 2,354 991 138% 172 295 -41.7%
#156 Infiniti QX50 2,326 2,283 1.9% 126 188 -33.0%
#157 Porsche Cayenne 2,325 2,389 -2.7% 211 175 20.6%
#158 Cadillac SRX 2,315 4,886 -52.6% 3 256 -98.8%
#159 Nissan Maxima 2,297 1,706 34.6% 104 165 -37.0%
#160 Chevrolet Suburban 2,173 1,354 60.5% 200 135 48.1%
#161 Lexus ES 2,153 2,305 -6.6% 215 166 29.5%
#162 Toyota Prius V ² 2,105 2,497 -15.7% 133 185 -28.1%
#163 BMW 2-Series 2,091 1,703 22.8% 55 174 -68.4%
#164 Mazda 6 2,053 2,703 -24.0% 155 151 2.6%
#165 BMW 5-Series 2,019 1,996 1.2% 194 225 -13.8%
#166 Kia Rondo 1,963 3,543 -44.6% 61 86 -29.1%
#167 Smart Fortwo 1,875 716 162% 228 36 533%
#168 Hyundai Veloster 1,831 2,971 -38.4% 58 96 -39.6%
#169 Ram Promaster City 1,804 2,059 -12.4% 210 178 18.0%
#170 Chevrolet Corvette 1,758 1,715 2.5% 59 39 51.3%
#171 Land Rover Range Rover Evoque 1,704 2,162 -21.2% 136 131 3.8%
#172 Nissan NV200 1,651 1,343 22.9% 150 143 4.9%
#173 Mazda 5 1,617 2,523 -35.9% 136 120 13.3%
#174 Volvo XC60 1,526 1,646 -7.3% 96 111 -13.5%
#175 Audi A5 1,516 1,693 -10.5% 70 78 -10.3%
#176 Dodge Dart 1,405 3,061 -54.1% 93 144 -35.4%
#177 Volkswagen Touareg 1,390 2,028 -31.5% 84 64 31.3%
#178 Nissan Leaf 1,375 1,233 11.5% 75 122 -38.5%
#179 Jaguar F-Pace 1,289 180
#180 Mercedes-Benz Metris 1,242 73 1,601% 83 37 124%
#181 BMW X4 1,236 1,144 8.0% 66 79 -16.5%
#182 BMW X6 1,178 1,274 -7.5% 108 78 38.5%
#183 Land Rover Range Rover 1,167 1,101 6.0% 107 123 -13.0%
#184 Lincoln MKZ 1,120 1,130 -0.9% 73 92 -20.7%
#185 Toyota 86/Scion FR-S 1,097 1,329 -17.5% 38 51 -25.5%
#185.1 Toyota 86 * 152 26
#185.2 Scion FR-S * 945 1,329 -28.9% 12 51 -76.5%
#186 Infiniti QX80 1,063 727 46.2% 82 71 15.5%
#187 Mercedes-Benz S-Class 1,049 1,126 -6.8% 85 70 21.4%
#188 Buick Envision 1,018 125
#189 Fiat 500 1,010 2,955 -65.8% 81 129 -37.2%
#190 Hyundai Genesis 961 1,377 -30.2% 1 70 -98.6%
#191 Hyundai Genesis Coupe 952 1,029 -7.5% 19 32 -40.6%
#192 Porsche 911 945 859 10.0% 64 48 33.3%
#193 Nissan 370Z 932 688 35.5% 24 34 -29.4%
#194 Mazda MX-5 Miata 903 630 43.3% 13 28 -53.6%
#195 Audi A7 887 787 12.7% 61 65 -6.2%
#196 Cadillac CTS 880 921 -4.5% 110 154 -28.6%
#197 Scion tC 868 1,135 -23.5% 11 54 -79.6%
#198 Ford C-Max 851 721 18.0% 48 54 -11.1%
#199 Buick Regal 841 968 -13.1% 48 51 -5.9%
#200 Audi A6 834 990 -15.8% 40 82 -51.2%
#201 Buick LaCrosse 785 990 -20.7% 68 45 51.1%
#202 Fiat 500X 766 609 25.8% 29 56 -48.2%
#203 Land Rover LR4 764 706 8.2% 7 57 -87.7%
#204 Lexus LX 748 348 115% 46 45 2.2%
#205 Subaru BRZ 740 800 -7.5% 21 26 -19.2%
#206 Nissan Armada 716 634 12.9% 85 47 80.9%
#207 Cadillac XTS 707 839 -15.7% 87 148 -41.2%
#208 Toyota Sequoia 697 663 5.1% 51 67 -23.9%
#209 Mini Countryman 694 1,412 -50.8% 84 -100%
#210 Volvo S60 657 665 -1.2% 20 45 -55.6%
#211 Chevrolet City Express 636 957 -33.5% 28 127 -78.0%
#212 Volvo V60 627 1,032 -39.2% 64 58 10.3%
#213 BMW 7-Series 626 358 74.9% 53 54 -1.9%
#214 Audi TT 599 251 139% 19 14 35.7%
#215 Toyota Avalon 586 765 -23.4% 21 38 -44.7%
#216 Lincoln Navigator 557 550 1.3% 58 55 5.5%
#217 Lexus GX 551 662 -16.8% 48 51 -5.9%
#218 Lexus CT 546 814 -32.9% 29 35 -17.1%
#219 Jaguar XF 542 466 16.3% 35 8 338%
#220 Lexus RC 526 792 -33.6% 26 27 -3.7%
#221 BMW i-Series 523 531 -1.5% 22 46 -52.2%
#222 Jaguar F-Type 522 462 13.0% 17 29 -41.4%
#223 Nissan NV 515 760 -32.2% 13 58 -77.6%
#224 Infiniti QX70 481 528 -8.9% 21 39 -46.2%
#225 BMW 6-Series 458 490 -6.5% 16 37 -56.8%
T226 Mercedes-Benz G-Class 439 269 63.2% 24 45 -46.7%
T226 Infiniti QX30 439 88
#228 Infiniti Q60 422 408 3.4% 53 9 489%
#229 Lexus GS 415 390 6.4% 27 28 -3.6%
#230 Jaguar XE 358 45
T231 Porsche Boxster 345 360 -4.2% 19 20 -5.0%
T231 Porsche Cayman 345 322 7.1% 22 31 -29.0%
#233 Jaguar XJ 323 343 -5.8% 55 43 27.9%
#234 Maserati Ghibli 318 364 -12.6% 25 38 -34.2%
#235 Porsche Panamera 300 341 -12.0% 21 27 -22.2%
#236 Fiat 500L 297 1,948 -84.8% 18 69 -73.9%
#237 Mercedes-Benz SLK-Class & SLC-Class 280 270 3.7% 9 10 -10.0%
#238 Fiat 124 Spider 258 20
#239 Cadillac CT6 250 37
#240 Nissan Xterra 227 1,707 -86.7% 103 -100%
#241 Mercedes-Benz SL-Class 221 281 -21.4% 17 9 88.9%
#242 Volvo XC70 218 426 -48.8% 32 -100%
#243 Audi A8 216 238 -9.2% 10 18 -44.4%
#244 Lincoln MKS 198 172 15.1% 1 7 -85.7%
#245 Maserati Levante 187 83
#246 Mercedes-AMG GT 175 145 20.7% 5 12 -58.3%
#247 Lincoln Continental 174 49
#248 Kia Cadenza 166 173 -4.0% 5 6 -16.7%
#249 Audi R8 158 89 77.5% 4 1 300%
T250 Infiniti Q70 156 217 -28.1% 15 22 -31.8%
T250 Nissan GT-R 156 130 20.0% 7 7 0.0%
#252 Toyota Land Cruiser º 133 180 -26.1% 18 7 157%
#253 Maserati Quattroporte 108 77 40.3% 19 6 217%
#254 Acura RLX 107 182 -41.2% 12 7 71.4%
#255 Lincoln MKT 102 217 -53.0% 5 13 -61.5%
#256 Volvo S90 101 14
#257 BMW Z4 100 121 -17.4% 19 -100%
T258 Lexus LS 95 123 -22.8% 9 6 50.0%
T258 Bentley Bentayga 95 23
#260 Mitsubishi i MiEV 86 121 -28.9% 2 11 -81.8%
#261 Bentley Continental GT 69 115 -40.0% 5 25 -80.0%
#262 Alfa Romeo 4C 68 122 -44.3% 2 8 -75.0%
#263 Maserati GranTurismo 65 65 0.0% 4 1 300%
#264 Dodge Viper 56 110 -49.1% 8 2 300%
#265 Genesis G80 55 24
#266 Volkswagen Eos 53 438 -87.9% 1 11 -90.9%
#267 Acura NSX 50 4
#268 Scion xB 47 948 -95.0% 27 -100%
#269 Honda CR-Z 40 55 -27.3% 5
#270 Genesis G90 38 24
#271 Mazda 2 27 761 -96.5% 3 -100%
#272 Kia K900 26 36 -27.8% 5 -100%
#273 Bentley Flying Spur 24 34 -29.4% 1 6 -83.3%
#274 Volvo S80 23 62 -62.9%
#275 Cadillac ELR 11 25 -56.0%
#276 Hyundai Equus 9 37 -75.7% 1 -100%
#277 Honda Crosstour 5 294 -98.3%
#278 Bentley Mulsanne 4 9 -55.6% 2 -100%
T279 Chevrolet Orlando 2 31 -93.5% 1 -100%
T279 Acura ZDX 2 1 100%
T279 Scion iQ 2 277 -99.3% 24 -100%
T282 Honda Insight 1
T282 Porsche 918 Spyder 1 21 -95.2% 3 -100%
#284 Ram Cargo Van 850 -100% 1 -100%
#285 Toyota Matrix 295 -100%
#286 Land Rover LR2 80 -100%
#287 Scion xD 27 -100%
#288 Jaguar XK 25 -100%
#289 Dodge Avenger 8 -100%
#290 Toyota FJ Cruiser 8 -100%
#291 Subaru Tribeca 5 -100%
#292 BMW 1-Series 3 -100%
#293 Nissan Cube 2 -100%
#294 Nissan Quest 2 -100%
#295 Chevrolet Avalanche 1 -100%
#296 Mercedes-Benz R-Class 1 -100%
#297 Ford -Brand 296,125 270,498 9.5% 19,161 18,756 2.2%
#298 Toyota -Brand 190,852 182,365 4.7% 11,912 11,095 4.5%
#299 Honda -Brand 166,449 156,503 6.4% 11,050 10,088 9.5%
#300 Chevrolet -Brand 151,460 148,735 1.8% 10,559 10,084 4.7%
#301 Hyundai -Brand 138,069 135,612 1.8% 5,796 6,600 -12.2%
#302 Nissan -Brand 122,059 118,655 2.9% 7,578 8,555 -11.4%
#303 Ram -Brand 93,405 96,744 -3.5% 6,836 6,665 2.6%
#304 GMC -Brand 84,666 85,757 -1.3% 5,274 6,420 -17.9%
#305 Jeep -Brand 82,958 79,680 4.1% 5,527 6,233 -11.3%
#306 Dodge -Brand 82,633 86,598 -4.6% 5,583 7,088 -21.2%
#307 Kia -Brand 71,670 67,914 5.5% 4,202 3,602 16.7%
#308 Mazda -Brand 69,210 71,709 -3.5% 4,722 4,852 -2.7%
#309 Volkswagen -Brand 60,017 70,344 -14.7% 2,709 4,508 -39.9%
#310 Subaru -Brand 50,190 46,609 7.7% 3,704 3,372 9.8%
#311 Mercedes-Benz -Brand 46,445 43,810 6.0% 3,425 3,385 1.2%
#312 BMW -Brand 38,012 35,002 8.6% 2,945 2,479 18.8%
#313 Audi -Brand 30,544 26,754 14.2% 1,937 1,893 2.3%
#314 Mitsubishi -Brand 22,293 21,384 4.3% 1,663 1,403 18.5%
#315 Acura -Brand 20,227 21,003 -3.7% 1,516 1,630 -7.0%
#316 Buick -Brand 19,053 16,594 14.8% 949 993 -4.4%
#317 Chrysler -Brand 16,050 24,405 -34.2% 774 1,713 -54.8%
#318 Cadillac -Brand 12,162 12,249 -0.7% 1,347 1,094 23.1%
#319 Infiniti -Brand 12,094 11,321 6.8% 1,009 921 9.6%
#320 Land Rover -Brand 9,140 7,720 18.4% 836 900 -7.1%
#321 Lincoln -Brand 8,320 7,939 4.8% 588 851 -30.9%
#322 Porsche -Brand 7,061 6,413 10.1% 550 450 22.2%
#323 Mini -Brand 6,609 7,050 -6.3% 350 525 -33.3%
#324 Volvo -Brand 6,103 4,788 27.5% 433 340 27.4%
#325 Scion -Brand 4,431 4,659 -4.9% 31 335 -90.7%
#326 Jaguar -Brand 3,034 1,296 134% 332 80 315%
#327 Fiat -Brand 2,331 5,512 -57.7% 148 254 -41.7%
#328 Smart -Brand 1,875 716 162% 228 36 533%
#329 Maserati -Brand 678 507 33.7% 131 45 191%
#330 Bentley -Brand 192 158 21.5% 29 33 -12.1%
#331 Genesis -Brand 93 48
#332 Alfa Romeo -Brand 68 122 -44.3% 2 8 -75.0%
#333 FORD MOTOR COMPANY 304,445 278,437 9.3% 19,749 19,607 0.7%
#334 FIAT CHRYSLER AUTOMOBILES 277,445 293,061 -5.3% 18,870 21,961 -14.1%
#335 GENERAL MOTORS 267,341 263,335 1.5% 18,129 18,591 -2.5%
#336 TOYOTA MOTOR CORP. 217,792 209,049 4.2% 13,688 13,096 4.5%
#337 HYUNDAI-KIA 209,832 203,526 3.1% 10,046 10,202 -1.5%
#338 HONDA MOTOR COMPANY 186,676 177,506 5.2% 12,566 11,718 7.2%
#339 NISSAN MOTOR COMPANY 134,153 129,976 3.2% 8,587 9,476 -9.4%
#340 VOLKSWAGEN GROUP 97,814 103,669 -5.6% 5,225 6,884 -24.1%
#341 DAIMLER AG 48,320 44,526 8.5% 3,653 3,421 6.8%
#342 BMW GROUP 44,621 42,052 6.1% 3,295 3,004 9.7%
#343 JAGUAR-LAND ROVER 12,174 9,016 35.0% 1,168 980 19.2%
1,948,899 1,898,996 2.6% 125,600 128,920 -2.6%
376,578 349,575 7.7% 24,827 25,329 -2.0%
90,810 89,877 1.0% 5,746 6,664 -13.8%
40,735 37,817 7.7% 24,827 25,329 -2.0%
Passenger Cars, SUVs, Crossovers
1,440,776 1,421,727 1.3% 91,578 93,381 -1.9%

Source: Automakers & Global Automakers Of CanadaANDC
* Italicized unranked lines are nothing more than available breakdowns, already included in the model’s total, not in addition to the model’s total.
² Total Prius Family sales: up 54% to 554 in December; up 13% to 8095 in 2016.
† Mini Cooper includes sales of the Hardtop, Convertible, Clubman, Coupe, Roadster, and Paceman.
¤ Automakers release sales figures for the E-Class and CLS-Class, M-Class and GLE together, GLK and GLC together, and the Passat and CC together. 
º Land Cruiser is a commercial vehicle in Canada. Audi’s A4 sales data includes sales of the Allroad. 
Sales data for brands such as Ferrari, Lamborghini, and Rolls-Royce are unfortunately not broken down by model. estimates say sales for those brands in 2016 were 216, 175, and 86 units, respectively. It is believed that Tesla sold 2034 new vehicles during the first ten months of 2016.