
Honda Motor Company Sales Data, Trends & Analysis for the U.S Automotive Market
Honda Motor Company, Ltd. (本田技研工業株式会社, Honda Giken Kōgyō Kabushiki gaisha) is a Japanese public multinational conglomerate corporation primarily known as a manufacturer of automobiles, motorcycles, and power equipment. Honda has been the world’s largest motorcycle manufacturer since 1959, as well as the world’s largest manufacturer of internal combustion engines measured by volume, producing more than 14 million internal combustion engines each year. Honda became the second-largest Japanese automobile manufacturer in 2001. Honda was the eighth largest automobile manufacturer in the world in 2015.
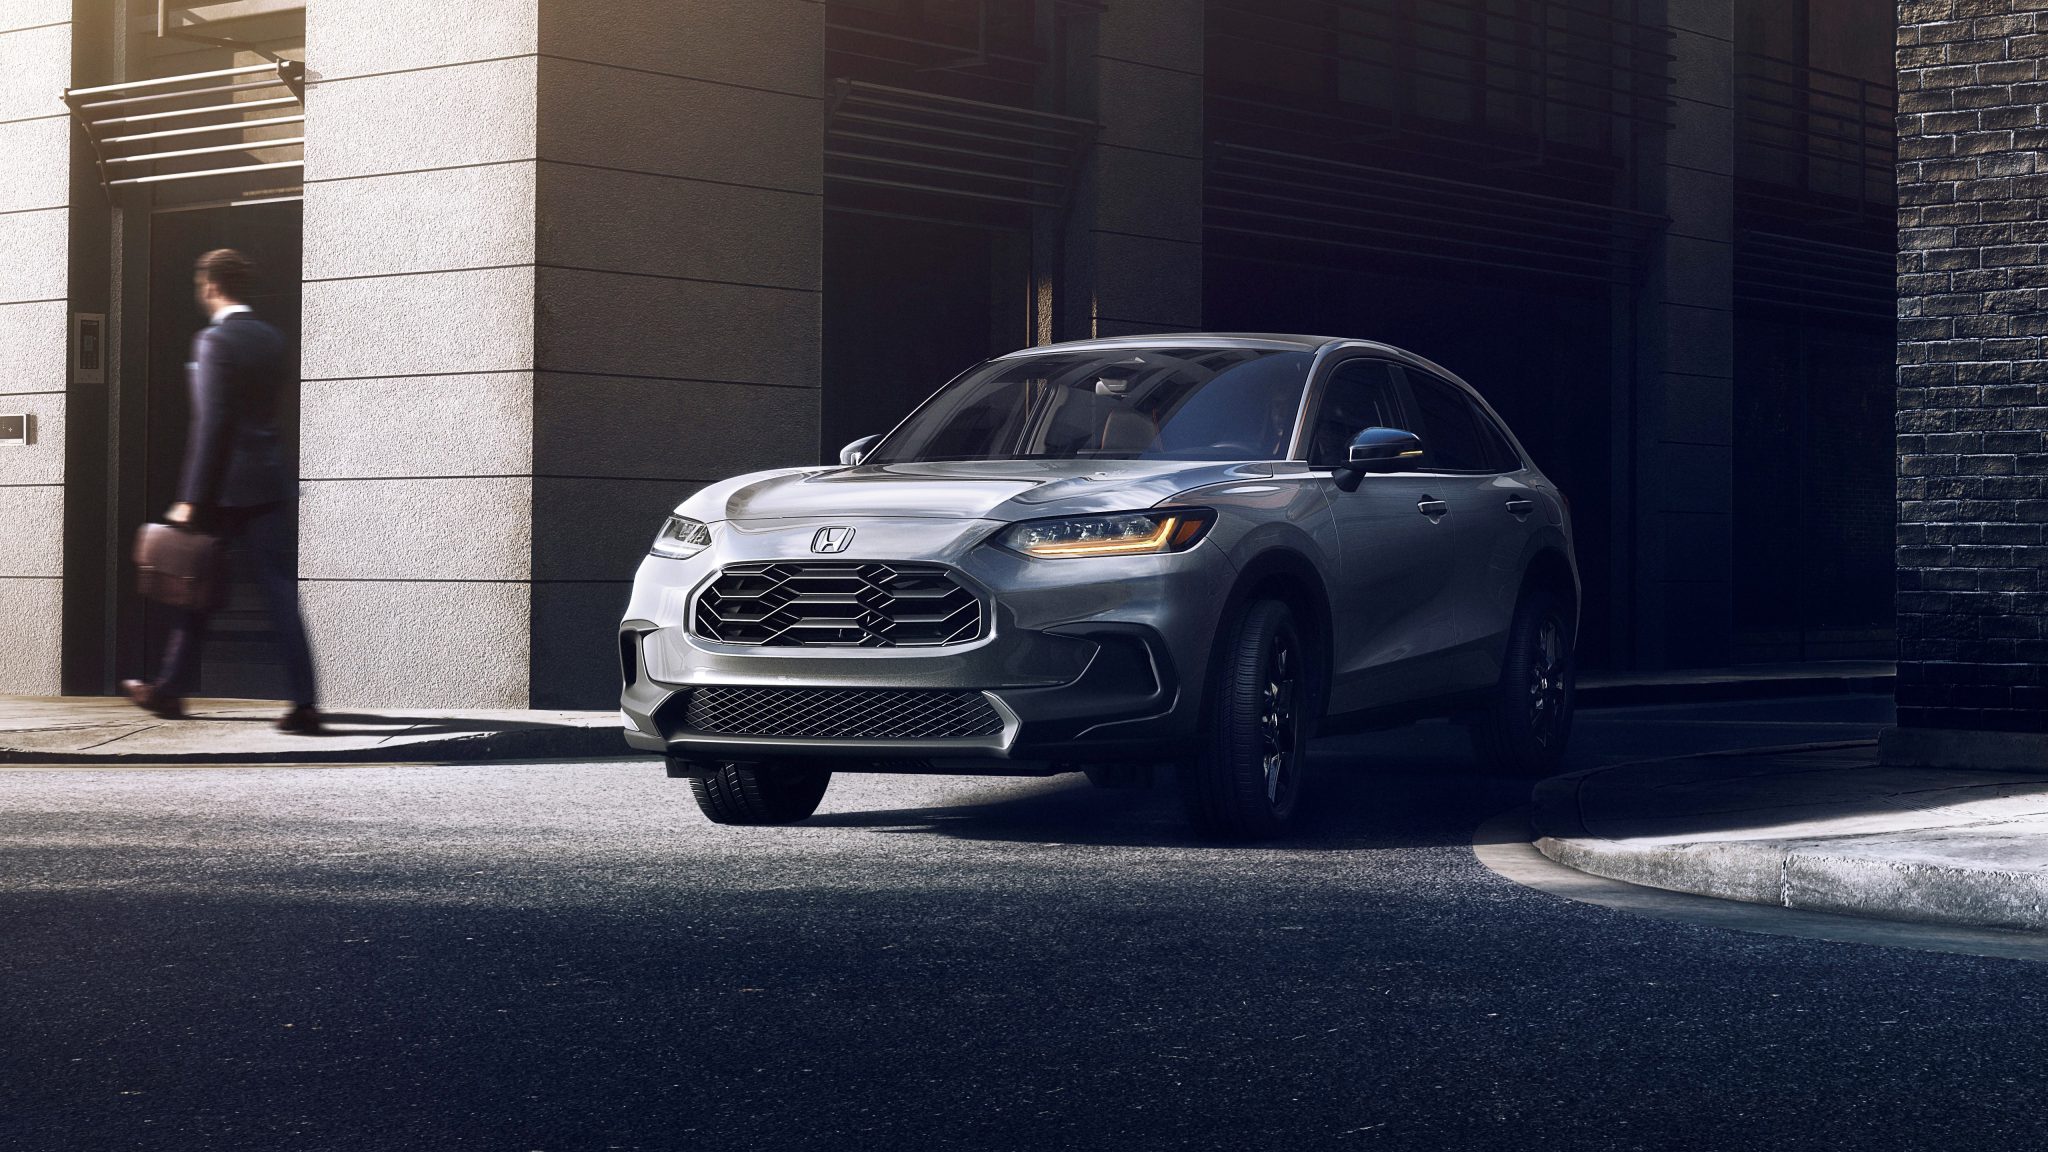
Honda produces a wide range of automobiles, including cars, SUVs, minivans, and trucks. Some of Honda’s most popular models include the Accord, Civic, CR-V, Pilot, and Odyssey. Acura is Honda’s luxury vehicle division, primarily catering to the North American market. Models under the Acura brand include the MDX, RDX, TLX, and ILX. Honda is a global company with over 440 subsidiary companies and 143 production facilities in 30 countries. It has a sales network in over 150 countries and employs over 220,000 people worldwide.
Honda Motor Company U.S Sales Figures & Recent Highlights
Honda Motor Co. began selling cars in the U.S. in 1970 with the introduction of the Honda N600. Since its entry into the American market, the company has experienced significant growth and established itself as a major player in the U.S. automotive industry. After introducing the N600, Honda solidified its reputation in the U.S. with the launch of the Civic in 1972 and the Accord in 1976. Both models have become staples in the American car landscape due to their reliability, fuel efficiency, and affordability. Over the decades, Honda has expanded its lineup with models such as the CR-V, Pilot, Odyssey, and Fit, among others. The CR-V, in particular, has been notably popular in the U.S., tapping into the growing SUV segment.
Honda introduced the Acura brand in 1986 as its luxury vehicle division for the North American market. Over the years, Acura has produced a range of sedans, SUVs, and performance vehicles tailored for American consumers. Models like the MDX, RDX, and TLX have seen success, with the MDX often being cited as one of the best-selling luxury three-row SUVs.
Up until 2022, Honda faced challenges similar to other automakers, such as adjusting to changing consumer preferences, dealing with the effects of the COVID-19 pandemic, and navigating global supply chain disruptions, especially the semiconductor shortage. However, the brand’s reputation for reliability and the successful introduction and refresh of core models, including electrified options, helped it maintain a strong presence in the market.
In 2022, Honda sold over 1.1 million cars in the US, accounting for over 9% of the total US car market. Honda is the fifth-largest automaker in the US market. Honda’s other brands have also performed well in the US. Acura, Honda’s luxury brand, sold over 160,000 cars in the US in 2022.
Honda Motor Company U.S Monthly Sales Data
Below we have a table that shows Honda Motor Company sales for the United States automotive market, but this time it is broken out by month. This is on a unit basis. This is Honda Motor Company new vehicle sales in the US across all its owned brands.
Honda Motor Company Annual Sales, Growth & Market Share in the United States
Below we have a table that shows total Honda Motor Company sales volumes for the US automotive market, broken out by year. This data captures all Honda Motor Company sales for the entire United States automotive market, including sub-brands.
| Year | Sales | YOY Change | Marketshare | Marketshare Change |
|---|---|---|---|---|
| 1984 | 48,445 | 0.00 | 2.30 | 0.00 |
| 1985 | 57,486 | 18.66 | 1.55 | -48.07 |
| 1986 | 91,689 | 59.50 | 2.30 | 32.66 |
| 1987 | 102,855 | 12.18 | 2.82 | 18.39 |
| 1988 | 122,554 | 19.15 | 3.18 | 11.22 |
| 1989 | 103,686 | -15.40 | 2.97 | -6.79 |
| 1990 | 94,316 | -9.04 | 3.13 | 5.07 |
| 1991 | 103,988 | 10.25 | 3.79 | 17.42 |
| 1992 | 63,772 | -38.67 | 2.46 | -54.49 |
| 1993 | 74,630 | 17.03 | 2.71 | 9.44 |
| 1994 | 65,253 | -12.56 | 2.71 | -0.04 |
| 1995 | 60,614 | -7.11 | 2.22 | -22.04 |
| 1996 | 39,867 | -34.23 | 1.44 | -53.75 |
| 1997 | 29,633 | -25.67 | 1.02 | -41.60 |
| 1998 | 27,861 | -5.98 | 0.89 | -14.33 |
| 1999 | 23,730 | -14.83 | 0.80 | -11.46 |
| 2000 | 22,092 | -6.90 | 0.79 | -1.58 |
| 2001 | 17,448 | -21.02 | 0.77 | -2.74 |
| 2002 | 5,490 | -68.54 | 0.23 | -232.34 |
| 2003 | 80 | -98.54 | 0.00 | -5,736.11 |
| 2004 | 0 | -100.00 | 0.00 | 0.00 |
| 2005 | 1,469,474 | 0.00 | 8.58 | 100.00 |
| 2006 | 1,509,358 | 2.71 | 9.05 | 5.20 |
| 2007 | 1,541,082 | 2.10 | 9.50 | 4.67 |
| 2008 | 1,424,573 | -7.56 | 10.68 | 11.10 |
| 2009 | 1,150,784 | -19.22 | 10.95 | 2.43 |
| 2010 | 1,230,468 | 6.92 | 10.50 | -4.32 |
| 2011 | 1,147,283 | -6.76 | 8.88 | -18.23 |
| 2012 | 1,533,032 | 33.62 | 9.82 | 9.58 |
| 2013 | 1,525,309 | -0.50 | 9.73 | -0.88 |
| 2014 | 1,541,132 | 1.04 | 9.32 | -4.43 |
| 2015 | 1,586,551 | 2.95 | 9.07 | -2.80 |
| 2016 | 1,637,853 | 3.23 | 9.31 | 2.61 |
| 2017 | 1,639,352 | 0.09 | 9.49 | 1.89 |
| 2018 | 1,604,561 | -2.12 | 9.23 | -2.75 |
| 2019 | 1,608,370 | 0.24 | 9.43 | 2.10 |
| 2020 | 1,336,787 | -16.89 | 9.09 | -3.79 |
| 2021 | 1,465,884 | 9.66 | 9.80 | 7.30 |
| 2022 | 983,507 | -32.91 | 7.18 | -36.43 |
| 2023 | 1,302,246 | 32.41 | 8.38 | 14.28 |
| 2024 | 333,724 | 0.00 | 8.80 | 0.00 |
Honda Motor Company U.S Annual Sales Units & Growth Chart
Below is a visual representation of Honda Motor Company ‘s U.S sales units over time. We have both the Honda Motor Company sales units and the growth in the United States market. Click on the items in the legend to see each series by itself.
Honda Motor Company U.S Growth Rate & Market Share Chart
Below is the annual growth rate for the Honda Motor Company in the United States, shown against the Honda Motor Company ‘s marketshare changes in the United States. This gives you a good look into how the Honda Motor Company has faired against the other brands in terms of absolute sales and effect on marketshare. Click on the items in the legend to see each series by itself.


