
Volvo XC90
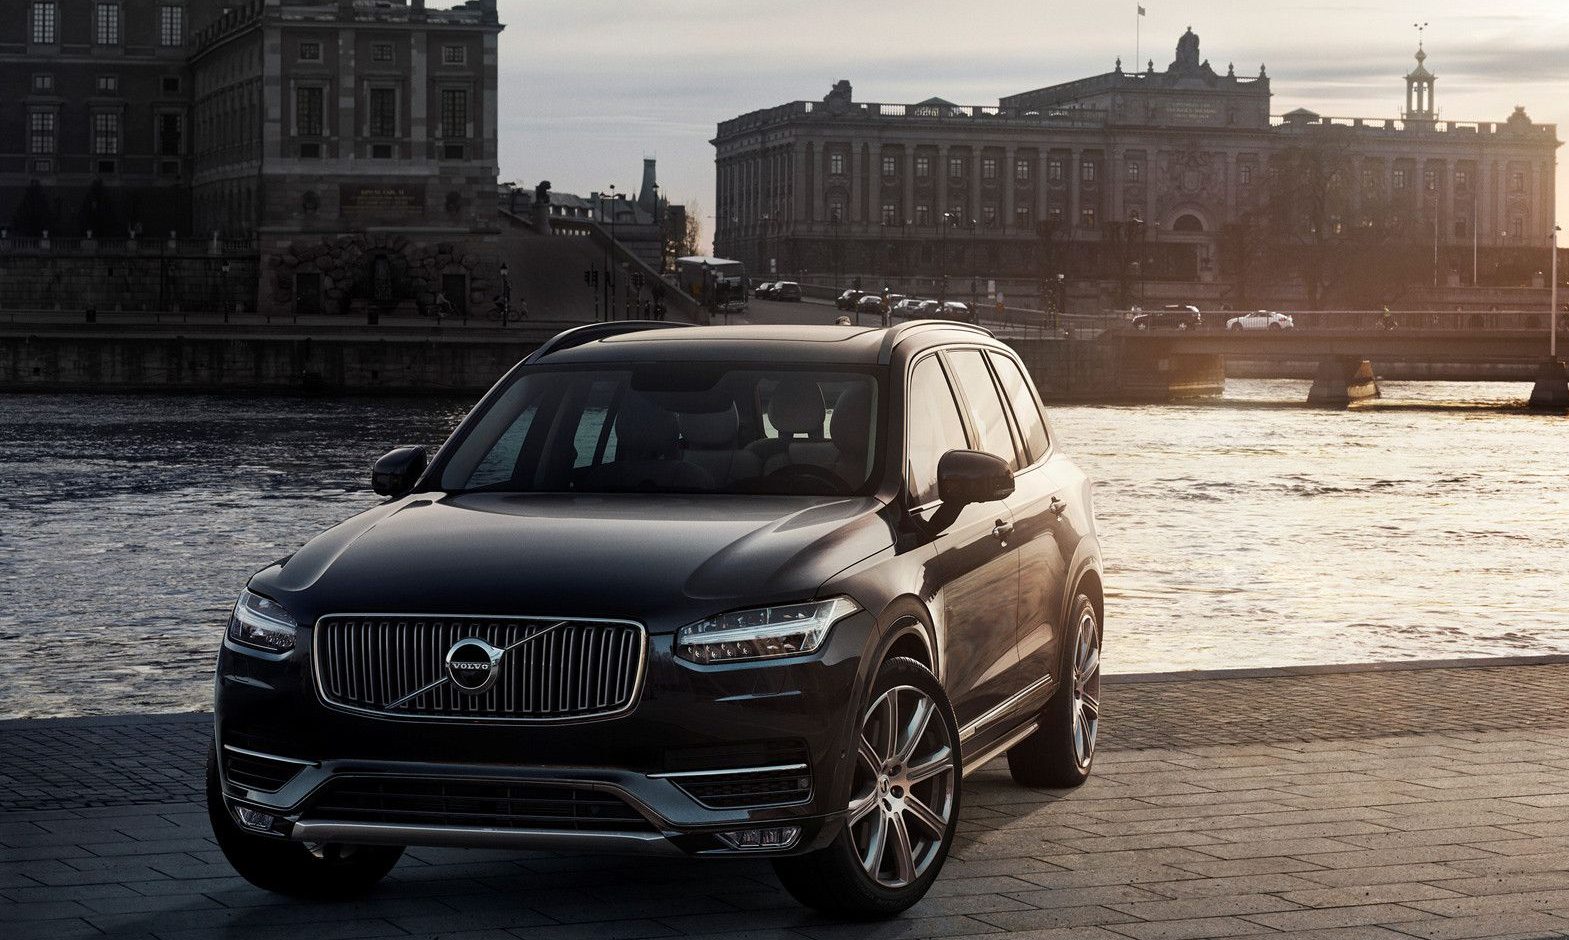
Here you will find monthly and yearly Canadian, European and U.S. sales figures for the Volvo XC90. The Volvo XC90 is a mid-size luxury SUV produced by the Swedish automaker Volvo Cars. Since its introduction in 2002, it has been one of Volvo’s best-selling models and has played a crucial role in the brand’s global reputation for safety, luxury, and Scandinavian design. The XC90 is a popular choice for those looking for a stylish, safe, and comfortable mid-size luxury SUV. It is also a good option for those who need a car that can handle light off-road driving.
Volvo XC90 Overview
The Volvo XC90 is a mid-size luxury SUV produced by Volvo Cars. It was first introduced in 2002 and is currently in its second generation. The XC90 is based on the Volvo Scalable Product Architecture (SPA) platform, which is also used by the Volvo 90 Series and 60 Series. It is powered by a variety of four-cylinder and six-cylinder engines, including gasoline, diesel, and hybrid engines. The XC90 is known for its stylish design, comfortable ride, and safety features. It has been awarded the highest possible safety rating from Euro NCAP and the Insurance Institute for Highway Safety (IIHS).
The original XC90 was introduced in 2002 and immediately gained attention for its safety features, comfortable interiors, and versatility. It was available with a range of gasoline and diesel engines over its production run. The second-gen XC90 marked a significant departure from its predecessor. Launched in 2015, it showcased Volvo’s new design language, platform, and technologies.
Volvo XC90 Sales Figures
Volvo XC90 US Sales Data & Charts
US Monthly Sales
US Annual Sales
| Year | Sales Units |
|---|---|
| 2005 | 35,976 |
| 2006 | 33,200 |
| 2007 | 31,336 |
| 2008 | 18,980 |
| 2009 | 10,757 |
| 2010 | 10,118 |
| 2011 | 10,609 |
| 2012 | 10,433 |
| 2013 | 6,845 |
| 2014 | 3,922 |
| 2015 | 12,777 |
| 2016 | 32,428 |
| 2017 | 30,996 |
| 2018 | 31,609 |
| 2019 | 35,760 |
| 2020 | 34,251 |
| 2021 | 38,657 |
| 2022 | 34,101 |
| 2023 | 39,920 |
| 2024 | 9,489 |
US Annual Growth
Volvo XC90 Canada Sales Data & Charts
Canada Annual Sales
| Year | Sales Units |
|---|---|
| 2012 | 454 |
| 2013 | 500 |
| 2014 | 427 |
| 2015 | 957 |
| 2016 | 2,951 |
| 2017 | 2,394 |
| 2018 | 3,059 |
| 2019 | 2,733 |
| 2020 | 2,389 |
| 2021 | 2,855 |
Canada Annual Growth
Volvo XC90 Europe Sales Data & Charts
Europe Annual Sales
| Year | Sales Units |
|---|---|
| 2002 | 1,143 |
| 2003 | 17,587 |
| 2004 | 32,032 |
| 2005 | 35,179 |
| 2006 | 34,921 |
| 2007 | 27,961 |
| 2008 | 15,999 |
| 2009 | 11,252 |
| 2010 | 14,691 |
| 2011 | 13,216 |
| 2012 | 9,387 |
| 2013 | 7,690 |
| 2014 | 6,931 |
| 2015 | 20,487 |
| 2016 | 35,471 |
| 2017 | 30,367 |
| 2018 | 30,356 |
| 2019 | 29,252 |
| 2020 | 24,584 |
| 2021 | 29,339 |
| 2022 | 26,407 |


