
Porsche Cayman Sales Data & Trends
Here you will find monthly and yearly Canadian and U.S. sales figures for the Porsche Cayman. From 2016, monthly sales figures of the Porsche Cayman and Boxster are combined and published under the new Porsche 718 name. The figures below reflect sales of the Cayman coupe exclusively.
Porsche Cayman Overview
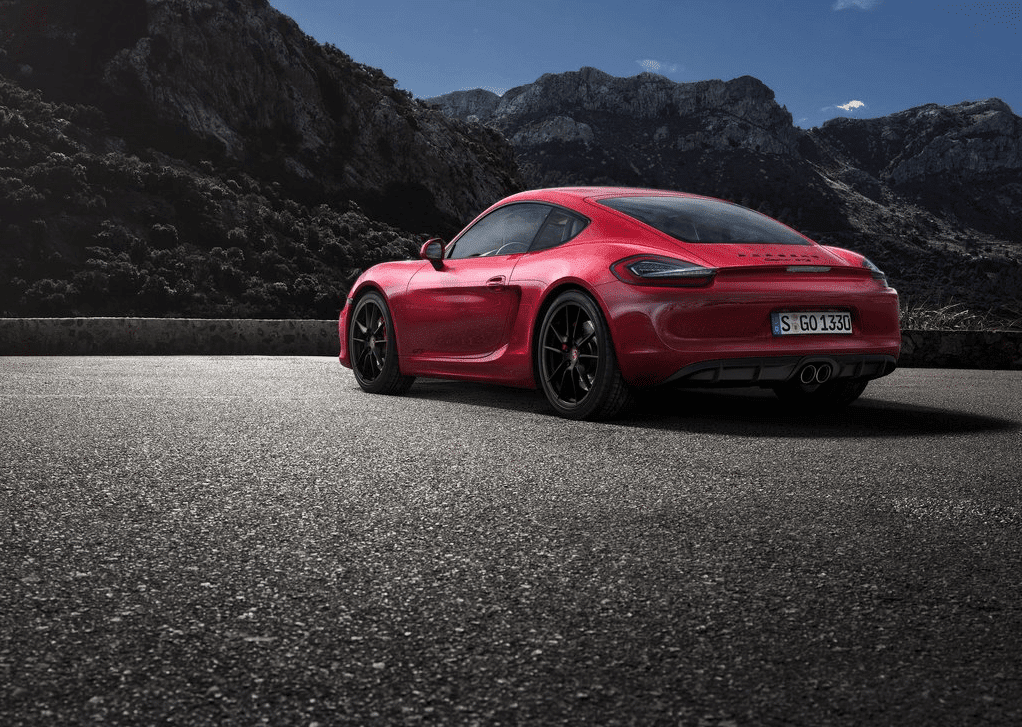
The Porsche Cayman is a mid-engined, two-seater sports car launched by the renowned German automaker Porsche. Introduced in 2006, the Cayman is a coupé derived from Porsche’s first-generation Boxster roadster. While it shares many components with the Boxster, the Cayman has its distinct character and has earned a reputation as one of the best handling sports cars in the world.
The Porsche Cayman was introduced in 2006, slotting into Porsche’s lineup as a hardtop companion to the Boxster and sitting between the Boxster and the iconic 911 in terms of pricing and performance. The Cayman, with its mid-engine layout, offers a balanced weight distribution, which has been praised for providing excellent handling dynamics. Over its life, the Cayman has been powered by a range of naturally aspirated and turbocharged flat-four and flat-six engines.
While the Cayman and Boxster share a platform and many components, there are differences beyond just the Cayman being a coupe and the Boxster being a roadster. The Cayman often gets slightly more power in comparable trims and can have a stiffer chassis due to its fixed roof, which some believe offers a slight edge in handling.
Porsche Cayman Sales Figures
Porsche Cayman U.S Sales Data & Charts
US Annual Sales
| Year | Sales Units |
|---|
US Annual Growth
Porsche Cayman Canada Sales Data & Charts
Canada Annual Sales
| Year | Sales Units |
|---|
Canada Annual Growth
Porsche Cayman Europe Sales Data & Charts
Europe Annual Sales
| Year | Sales Units |
|---|


Looking back there will probably be fewer Gen2 cars total 2009-2012, than just 2006. Also to note 2006 models were all Cayman S's. Were all the other years' sales #s are split between 2-3 models. Cayman, Cayman S, and in 2012 also Cayman R.