Here you will find monthly and yearly Canadian and U.S. sales figures for the Volvo 60 Series. These statistics include combined sales data of the Volvo S60 sedan, from 2014 of the Volvo V60 station wagon and V60 Cross Country, and from 2015 of the S60 Cross Country. Sales data for each of these are also published separately.
Volvo 60 Series Overview
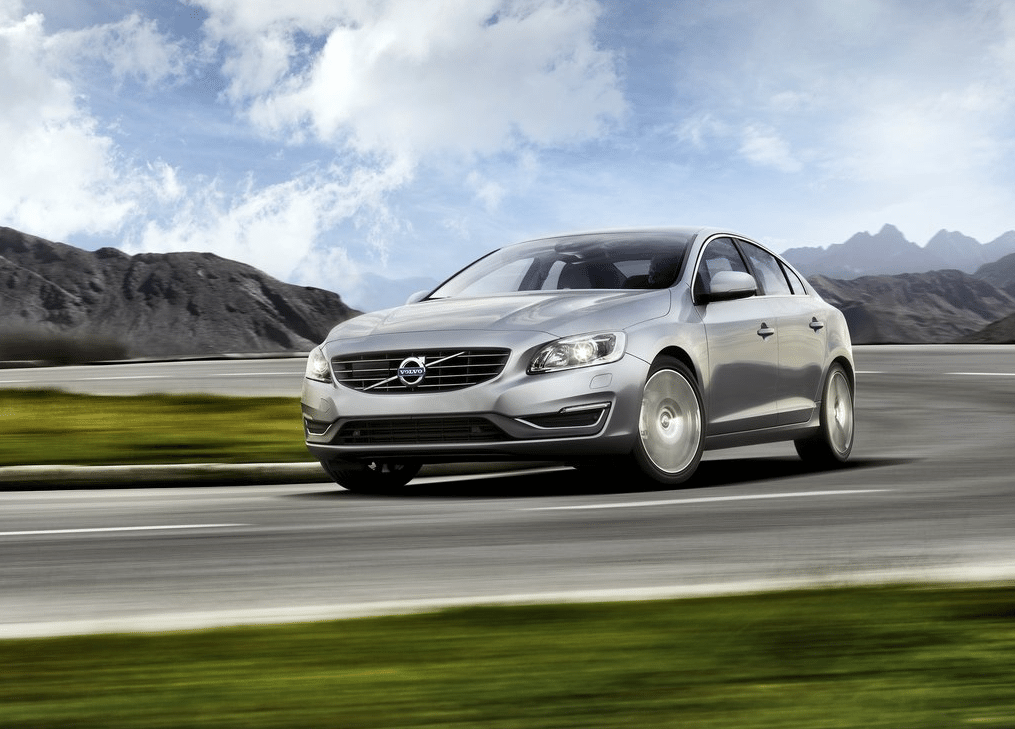
The Volvo 60 Series is a line of mid-size cars produced by Volvo Cars. It was introduced in 2000 and is currently in its third generation. The 60 Series is available as a sedan (S60), wagon (V60), and crossover (XC60). The 60 Series is based on the Volvo Scalable Product Architecture (SPA) platform, which is also used by the Volvo 90 Series and XC90. It is powered by a variety of four-cylinder and six-cylinder engines, including gasoline, diesel, and hybrid engines. The 60 Series is known for its stylish design, comfortable ride, and safety features. It has been awarded the highest possible safety rating from Euro NCAP and the Insurance Institute for Highway Safety (IIHS). The 60 Series is a popular choice for those looking for a stylish, safe, and comfortable mid-size car. It is also a good option for those who need a car that can handle light off-road driving.