
Jaguar XJ
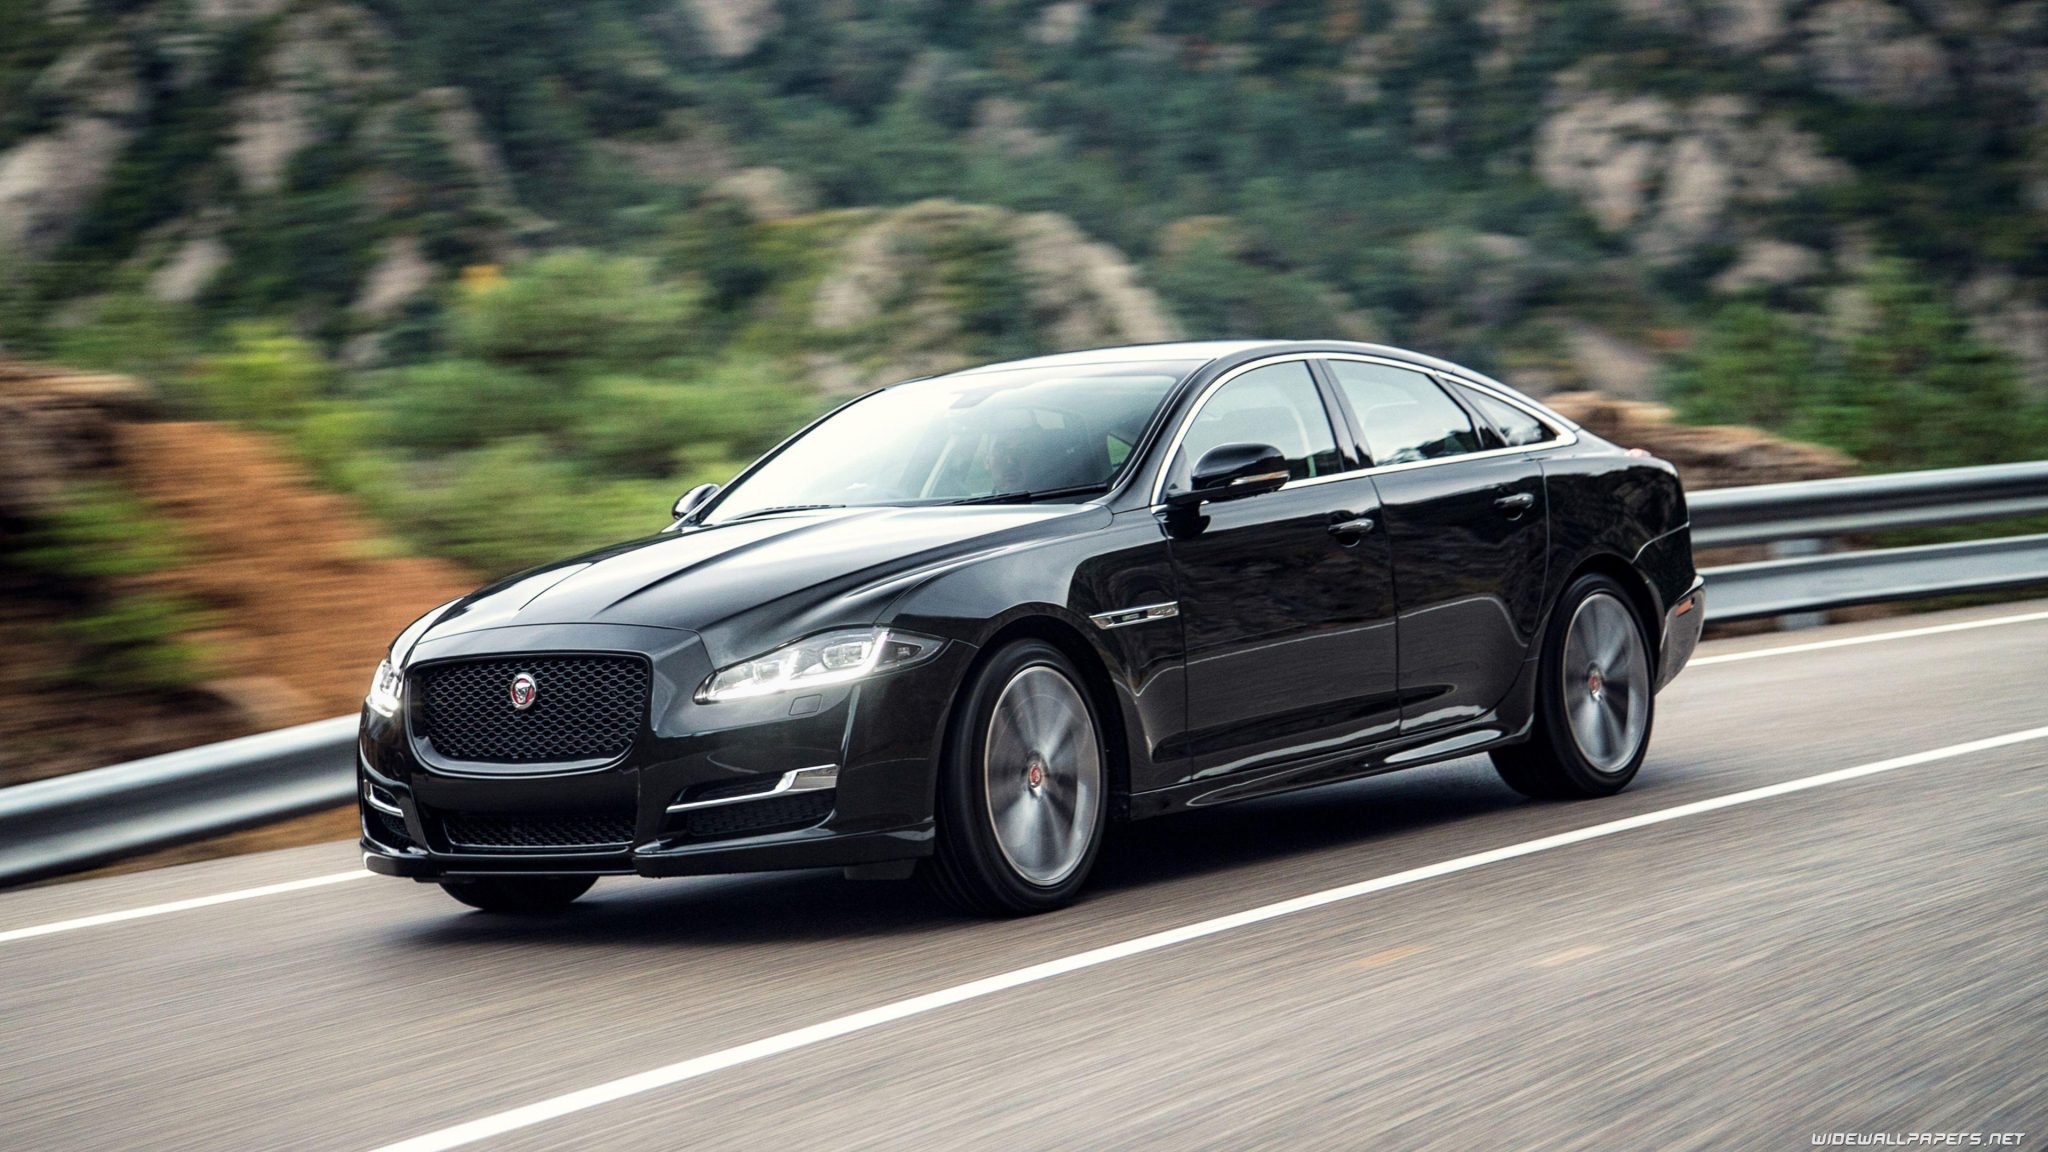
Here you will find sales figures for the Jaguar XJ. The Jaguar XJ is a series of full-size luxury sedans produced by British automobile manufacturer Jaguar. The model has been Jaguar’s flagship car for much of its production and has been through various generations since its inception.
Jaguar XJ Sales Overview
Introduced in 1968, the original XJ was a breakthrough in terms of design and technology, becoming an instant icon. It was famous for its sleek design, lightweight construction, and sophisticated suspension system. Since its introduction, the XJ has seen multiple generations, each introducing new design elements, technology, and performance features. Over the years, the XJ has been offered with various engines, including inline-six, V8, and V12 engines. Some generations also featured diesel options. In July 2019, production of the XJ came to an end, marking the conclusion of the nameplate’s continuous run. However, there have been reports and speculations about a possible revival of the XJ as an all-electric vehicle. As Jaguar’s flagship sedan for several decades, the XJ has left a significant mark on the automotive industry. Its blend of design, luxury, performance, and innovation has influenced many subsequent luxury vehicles.
Jaguar XJ Sales Figures
Jaguar XJ US Sales Data & Charts
US Annual Sales
Year Sales Units
US Annual Growth
Jaguar XJ Canada Sales Data & Charts
Canada Annual Sales
| Year | Sales Units |
|---|
Canada Annual Growth
Jaguar XJ Europe Sales Data & Charts
Europe Annual Sales
| Year | Sales Units |
|---|


