The Top-Selling Vehicles in Canada Automotive Market for 2017
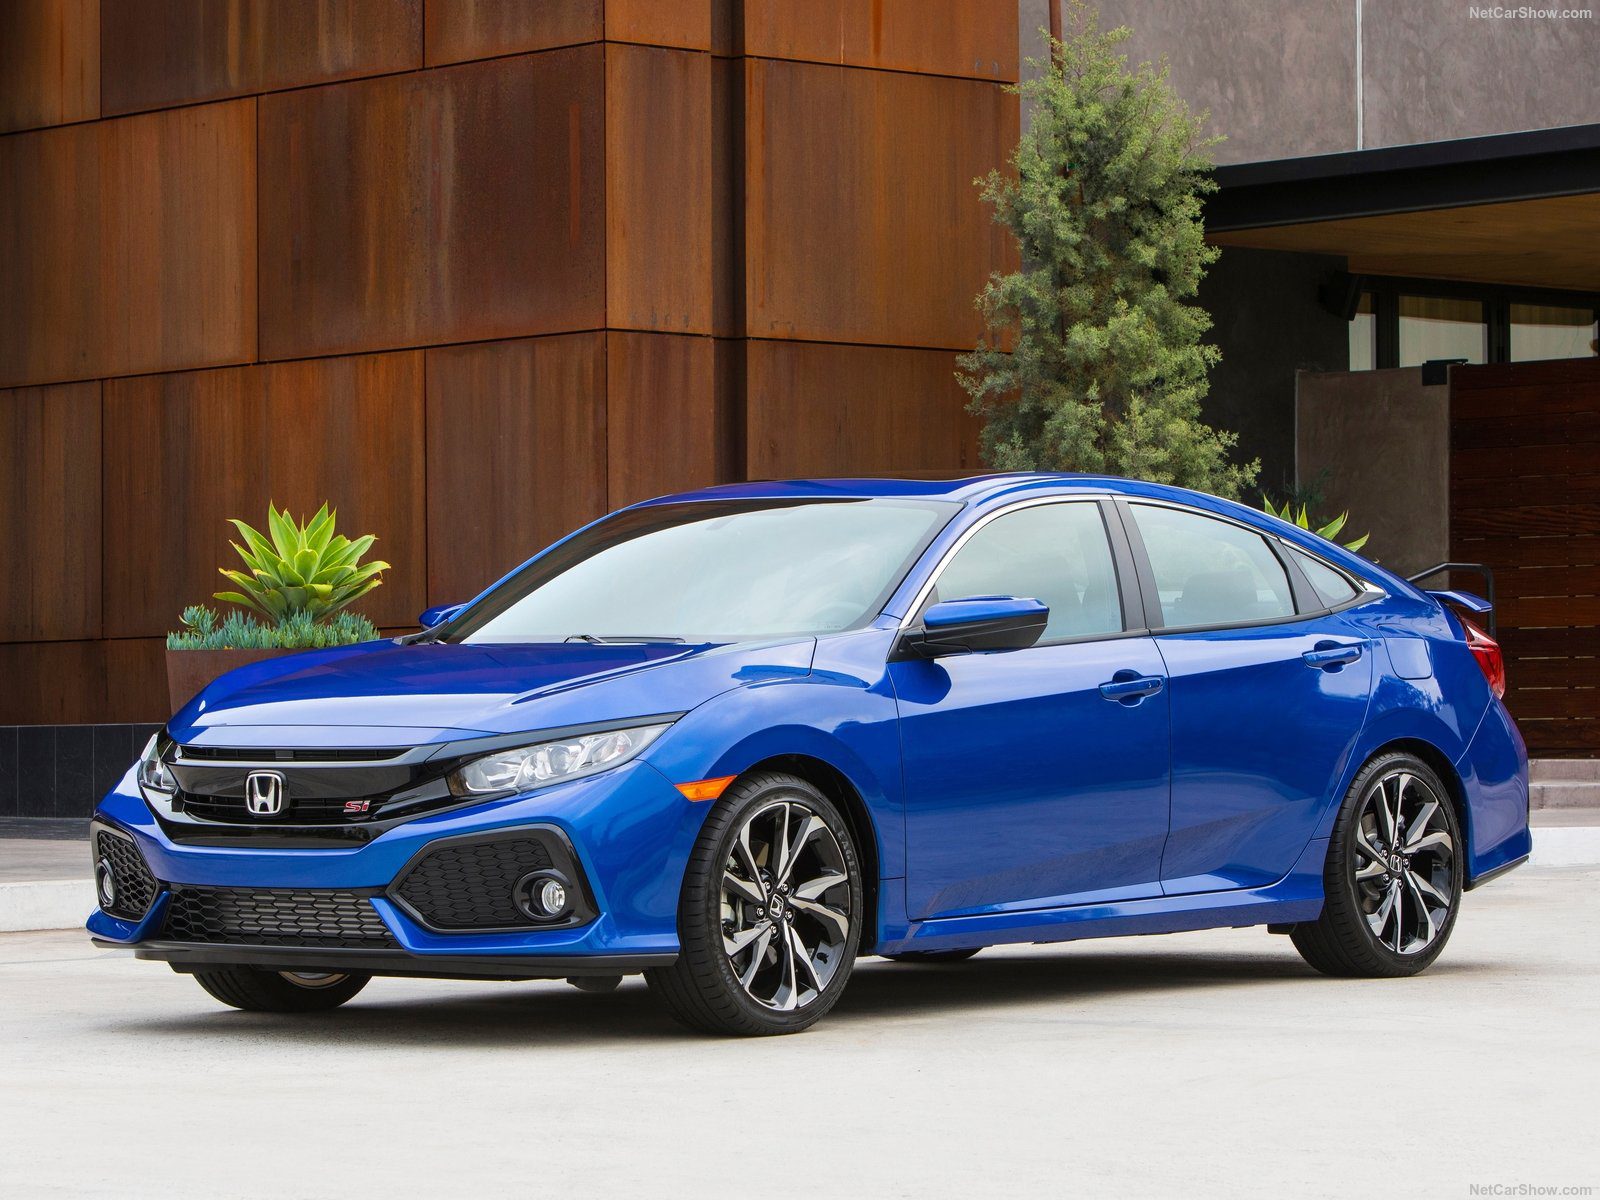
Here you will find the Top 20 best selling car sales leaders in Canada for December 2017. Each month we compile the Top 20 best selling car sales data and reports for North American markets and analyze it to create the best selling list below. The Honda Civic remained Canada’s favorite passenger car in 2017, pushing ahead 6.9% on 2016’s totals as the tenth generation, unveiled for the 2016 model-year, hits its stride. Its nearest rival? The Toyota Corolla, which ended 2017 ahead of the Hyundai Elantra but no closer to the Civic in terms of sales volume for the year as a whole.
The Elantra slid back 5.7% during the same time as the Corolla posted 10.3% growth and resulting in the pair switching places in terms of year-to-date volume. In December 2017 alone however, the Hyundai Elantra outsold the Civic, Corolla and Chevrolet Cruze, all of whom outsold it in December 2016 in Canada. Hyundai as a brand increased its Canadian sales 23% overall on December 2016, with the Elantra’s 33.9% growth over that month’s figures among the sharpest-growing nameplates in Hyundai’s lineup. The VW Golf rises to sixth from eighth last December, the Toyota Camry rises to seventh from twelfth in December 2016 and the premium sedan Mercedes-Benz C-Class outsold the aging Ford Focus in the final month of 2017.