The Top-Selling Vehicles in the U.S Automotive Market for 2018
In 2018, the best-selling vehicles in the U.S. were dominated by trucks and SUVs. The Ford F-Series, particularly the F-150, has been the best-selling vehicle in the U.S. for decades, and 2018 was no exception. Another full-size pickup truck, the Chevy Silverado consistently ranks near the top of the best-sellers list in the U.S. Ram pickups have also been very popular and have secured a strong position in the U.S. market.
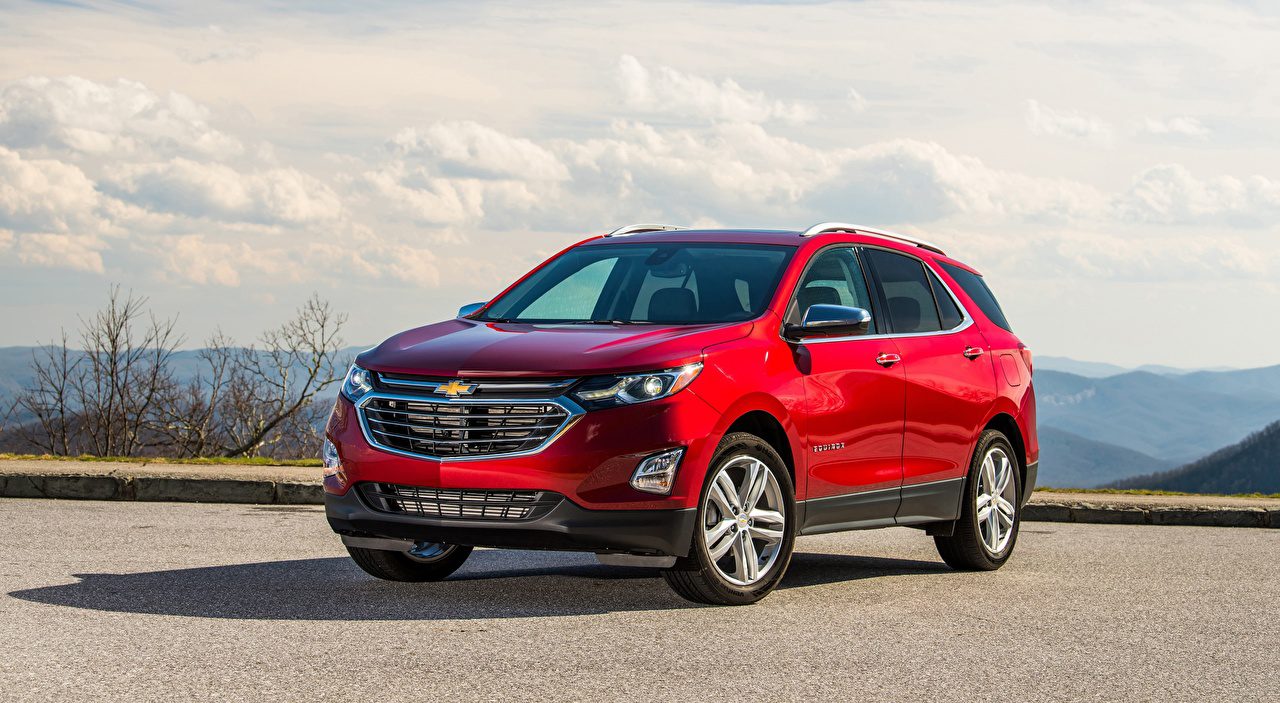
In the SUV category, once again it was the small to midsize SUVs that topped the sales charts. The Toyota RAV4 has become increasingly popular, leading its segment in sales. Close behind is the Honda CR-V, Honda’s compact SUV and another top-seller, known for its reliability and efficiency. Chevy’s offering, the Chevrolet Equinox also saw strong sales in 2018. Nissan’s compact SUV has been gaining popularity in the U.S., often competing closely with the RAV4 and CR-V for sales in its segment, while the Ford Escape was another popular seller. When it comes to passenger cars, there were no surprises. The Camry has been the best-selling sedan in the U.S. for many years, known for its reliability and value. The Honda Civic compact car has a loyal following and has consistently been a top-seller.